How to create an implantation scheme (Stereotactic EEG) ?
This functionality is designed for advanced users. It enables to draw a 2D or a 3D view of the depth electrodes.
Two options are available :
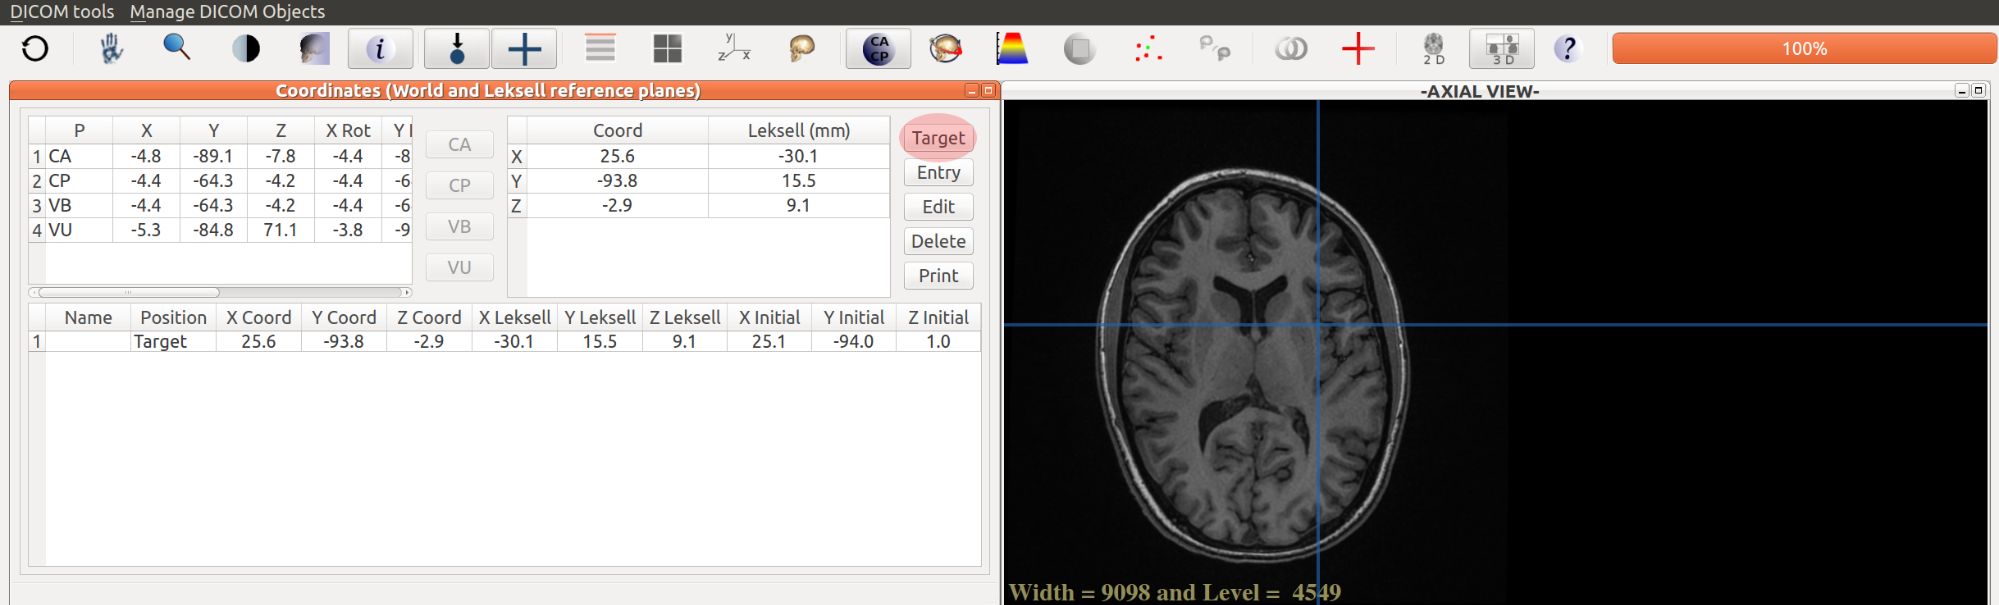
The "depth electrodes" table is the place where the coordinate values of the depth electrodes are kept in memory.
When the user press the icon , the projection of the depth electrodes is displayed on each viewing window. The darker color corresponds to the target (red for depth electrodes on the left hemisphere, green for depth electrodes on the right hemisphere, see below:
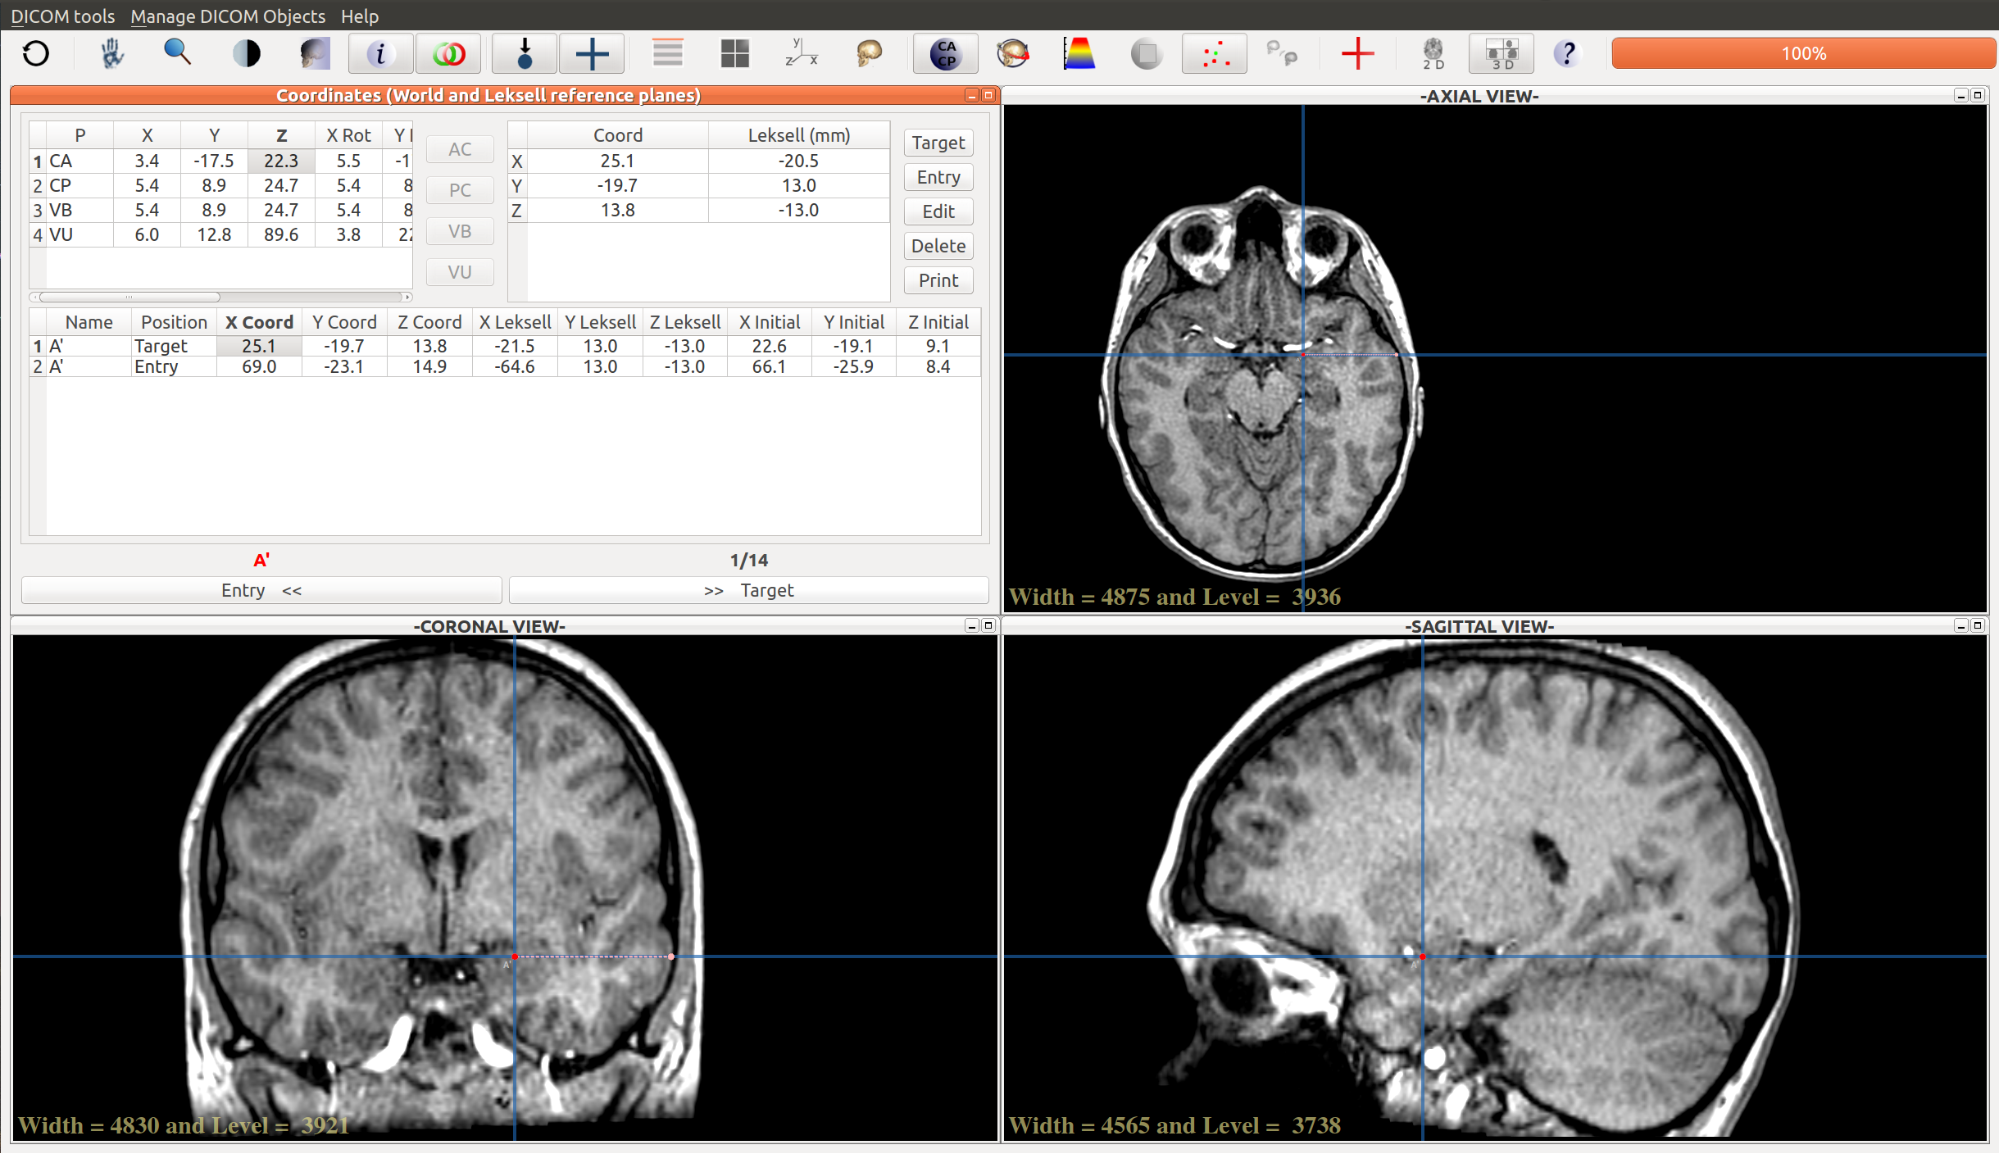
When the user double-click on a row of the “depth electrodes” table, the viewing windows are automatically updated to the point coordinate registered in the table.
The user can navigate quickly between the target and entry points of the depth electrodes using the “move one step to the target point” or “move one step to the entry point” tool button at the bottom of the coordinates window. Each step is of 1.6 mm length according to the interval between two recording points of Dixi© depth electrodes. The current recording point number and the total number of the recording points are displayed.
see above :
A’ 1/14 =
The name of the depth electrode is displayed on the left bottom of each target point. The left depth electrodes are colored in red, the right depth electrodes are colored in green.
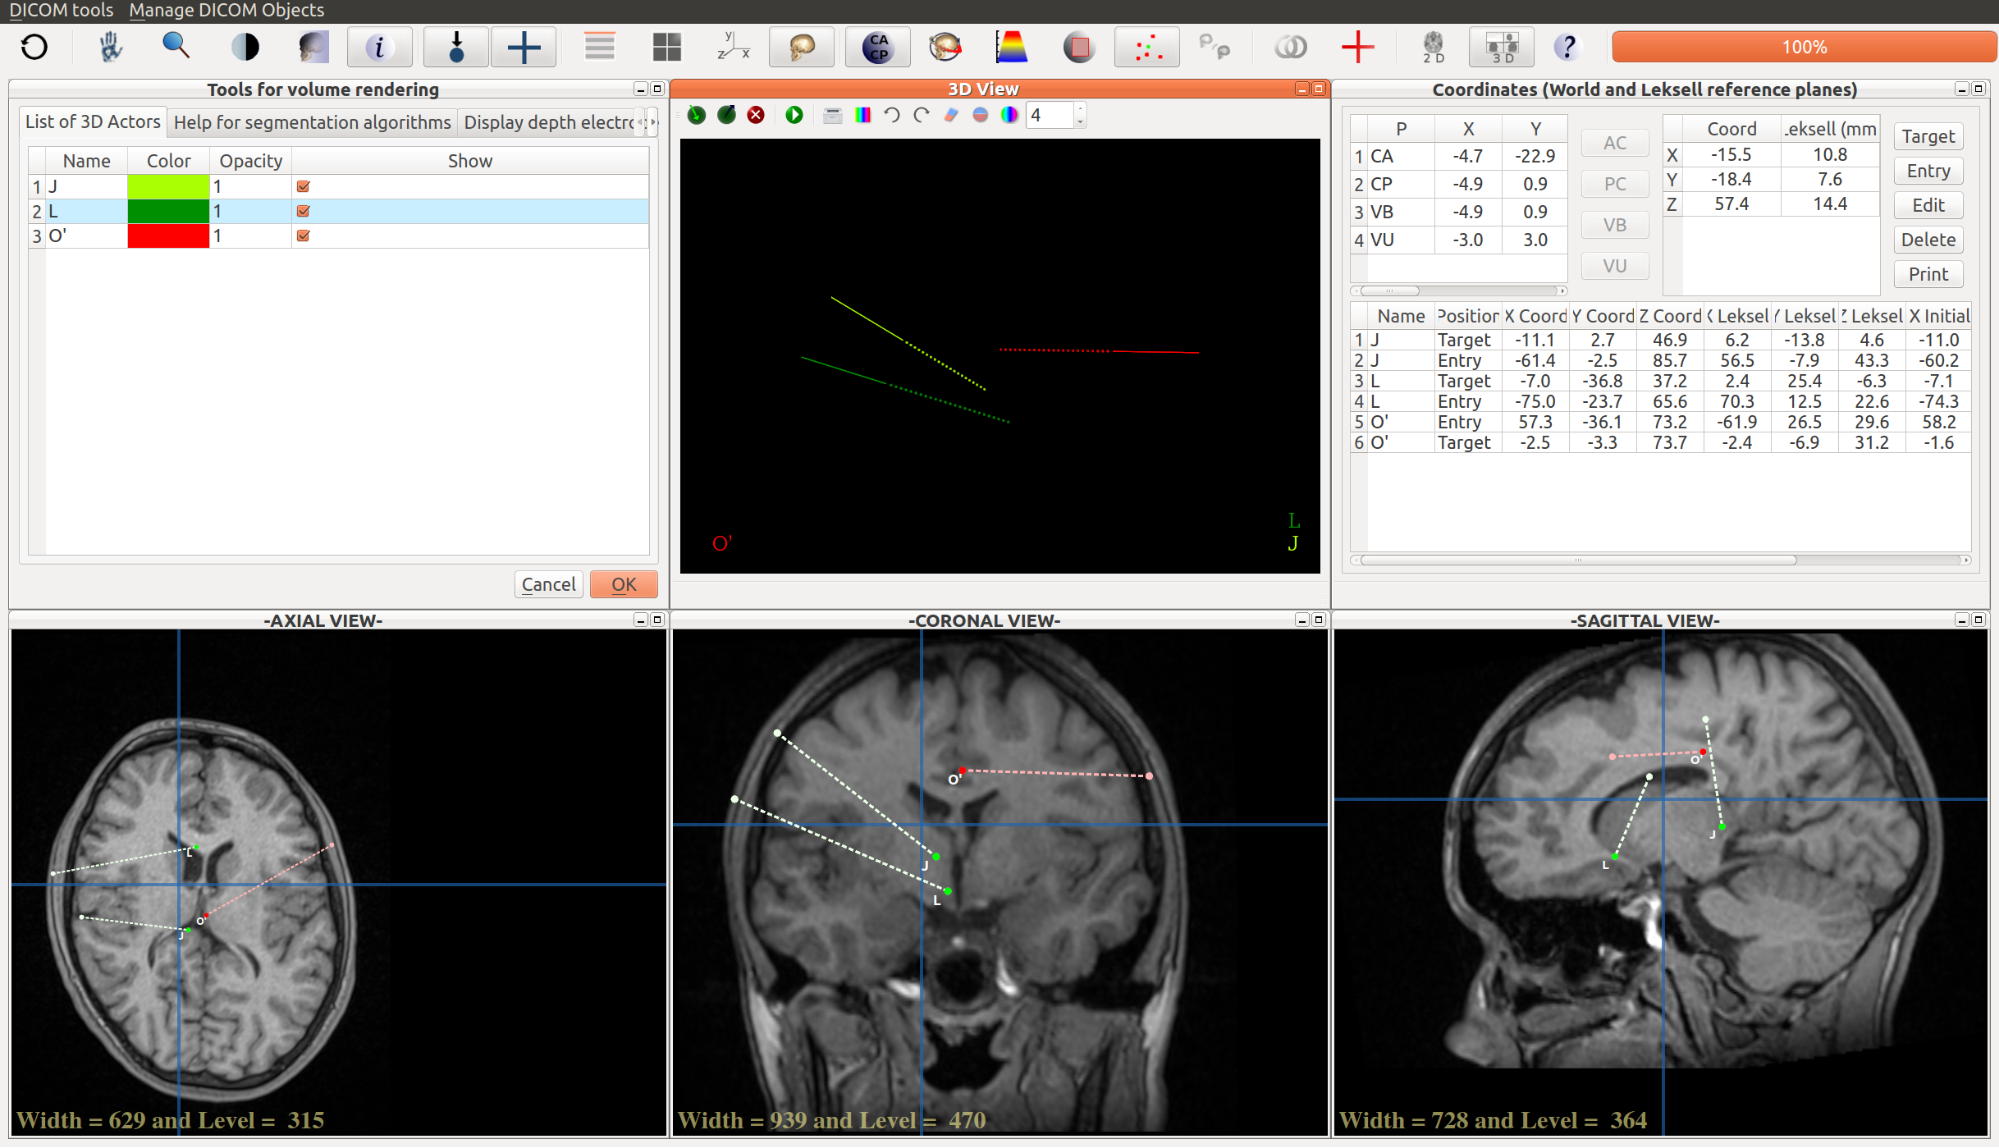
Creation of a 3D view of the depth electrodes
It is also possible to create a 3D view of the depth electrodes and to display them alone or associated with 3D structures such as a volumetric representation of the gray matter or a volumetric representation of the bone segmentation.
This functionality is accessible through the icon . Click on tab “Display depth electrodes - slices”. Check the box “depth electrodes” and press OK.
The depth electrodes are now displayed in the 3D viewing window “3D View”.See below the difference between the two ways of representing the depth electrodes:
JimboDICOMViewer
User’s manual apr-2015